Tuesday, December 31, 2013

Toothless in Tennessee


As part of my continuing series on health data from the 2010 Behavioral Risk Factor Surveillance Survey (BRFSS), I thought I'd look at seniors who are missing all their teeth.  While this may seem a humorous topic, having poor oral health can open the door for bacteria and shave around 7 years off your life.

This map breaks the data by standard deviations from the mean/average.  So the pale, gray/white states' seniors are average -for the USA- in the percentage who are toothless.  The purple states have higher percentages of toothless seniors with WV, TN, MS, and KY having the worst data on senior oral health.

My friend Lee B. from Clinton, CT, used to tell me that people in Connecticut had great teeth.  Apparently she is right because the Nutmeg State and Hawaii have the most older Americans with their choppers.

Monday, December 30, 2013

Non-Smokers

To follow up on yesterday's post about which states have had the most success in adults quitting smoking, here is another map looking at differences between states in terms of non-smokers.  Utah by far leads the pack in regards to the highest number of adults who have never smoked.  The majority of adults in 48 of the 50 states have never smoked (see yesterday's post for which two states have more adults who have smoked than adults who have never smoked).

Sunday, December 29, 2013

Where Have Smoking Cessation Programs Had the Biggest Impact?

In this continuing series on health data, let's look today at smoking.

The CDC lists smoking as the #1 preventable cause of early death.  Around 40% of people who smoke will eventually develop some type of health problem related to smoking.  Thus, smoking cessation and prevention programs for decades have -successfully I might add- greatly reduced the number of Americans to smoke.

In looking at data from the CDC's Behavioral Risk Factor Surveillance Survey (BRFSS) of adult health behaviors, I was curious if there were any regional differences showing where smoking cessation programs have had the biggest impact.  And it appears the answer is YES! -specifically in New England and Arizona which so the biggest percentages of people who have quit smoking.  

Let's look at the maps individually:

In every state except two, most adults have never smoked.  Only in Kentucky and West Virginia do the number of current or former smoker exceed 50% (52% each actually).  I have kept the legend values the same on these 4 maps, however, for comparison purposes.

By 2010 the number of adults who smoke daily in every state is below 1 in 5 -except in West Virginia where daily smokers exceed 20% of the population.


Interestingly, most American adults who smoke also smoke daily.  Less than 10% of American adults report they smoke but only a few days a week.

This last map shows the key differences.  People in Utah are the least likely to ever smoke.  Thus, Utah also has the lowest percentage of former smokers -because fewer people ever started smoking.  In most of the rest of the country, the percentage of former smokers is somewhere between 20-30% of the adult population.  The key exceptions are VT, NH, ME, and AZ where a larger percentage of the population has stopped smoking.  All four of these states actually had higher percentages of adults who have smoked or currently smoke but have had more success in adults quitting.


Friday, December 27, 2013

What's Your Sign, Baby?


Here is a little map just for fun.  You likely know your zodiac sign based on your birthday, but did you know that states have signs too?  Yes indeedy, they do -based on their statehood date.  So let's look at Mama USA's children by zodiac sign.  

First of all, the good ol' USA is a Cancer "born on the 4th of July" as the song Yankee Doodle Dandy teaches us.  I have actually read, however, that some astrologers argue the USA was born the day the Constitution was ratified -and thus is a Gemini.  That would certainly be a sign fitting Blue State/Red State America with its twin personalities.

So let's look at the 12 signs and their states:

Aries:  Poor Aries!  There are no Aries states.  

Taurus:  Taurus Minnesota gives birth to the Mississippi River, and Taurus Louisiana watches the river empty into the Gulf of Mexico.  For an earth sign, Taurus states seem to like their lakes and coasts with Maryland giving us all those yummy crab cakes (but then they say the Crab and Bull get along nicely like surf and turf on a plate.) ;)

Gemini:  Gemini states fittingly dominate the Border States of the Upper South:  Arkansas, Tennessee, Kentucky, and West Virginia.  South Carolina, Rhode Island, and Wisconsin are also Geminis.

Cancer:  Cancer is supposed to be the sign of motherhood and so it is fitting that Virginia, the "mother of presidents", is a Cancer state along with New Hampshire, Idaho and Wyoming.

Leo:  Leo rules theater and so it is fitting that New York's Broadway is in a Leo state.  Fire sign Leo also includes Hawaii's volcanoes, Missouri, and Colorado.

Virgo:  We only have one Virgo state, but it is quite a state:  California.

Libra:  Poor Libra!  No states for you either.  Perhaps we should create two new states:  one for Aries and one for Libra.

Scorpio:  Scorpio, the passionate sign of sexiness and secrets, rightfully is the sign of Nevada with its Sin City and Area 51.  In fact, Nevada's statehood day is Halloween!  Scorpio also has the USA's only twin states sharing the same birthdays:  North and South Dakota.  Montana, Oklahoma, and Washington state are also Scorpios.

Sagittarius:  Sags rule!  ...At least in terms of the number of states.  Eight states are Sagittarians:  Alabama, Mississippi, Pennsylvania, Delaware, New Jersey, Indiana, Illinois, and North Carolina.

Capricorn:  Capricorn states cover the most territory with the #1 and #2 largest states -Alaska and Texas.  Utah, Connecticut and New Mexico make up the other three Cap states.

Aquarius:  Aquarian Oregon was actually born on Valentine's Day and shares the sign of Aquarius with Michigan, Kansas, Massachusetts, and Arizona.

Pisces:  Watery Pisces rounds out the zodiac with a bevy of Fish states:  Vermont, Maine, Florida, Ohio, and Nebraska.

Saturday, December 21, 2013

...and Utah makes 18

Yesterday's ruling by Federal Judge Shelby overturning Utah's state constitutional ban limiting marriage to opposite sex couples opened the door to legal same sex marriages in Utah.  The District of Columbia and the other 16 states with legal same sex marriage vote consistently Democratic, but Utah is the first "Red State" to legalize same sex marriage.  Utah is not only a Republican stronghold but also the reddest of the red states with the highest percentage of voters voting Republican in Presidential elections recently.

The Utah ruling is also the first use the US Supreme Court's decision in the Windsor case.  Windsor is the decision which found the 1996 Defense of Marriage Act (DOMA) unconstitutional.  Judge Shelby's decision borrows heavily not only from the main Windsor decision but also conservative Justice Scalia's dissent. Scalia's dissent predicted that opening up Federal benefits nationally to married couples would spell the end of the state mini-DOMAs.

Let's look at the growing divide regionally on the issue of same sex marriage:

Percentage of States Where Same Sex Marriages Are Legal at the State Level
New England (MA, VT, NH, CT, RI, and ME):  100%
Mid-Atlantic (DC, MD, DE, NJ, PA, and NY):  83%
Midwest (IA, MN, IL, WI, MI, IN, OH):  43%
West (NM, CO, WY, MT, ID, UT, AZ, CA, HI, AK, OR, and WA):  39%

vs.

South (former Confederate states of TX, LA, AR, TN, VA, NC, SC, GA, FL, AL, and MS):  0%
Plains states (OK, KS, NE, SD, and ND):  0%
Border states (MO, KY, WV):  0%

Friday, December 20, 2013

Kentucky Lung Cancer Death Rates By County

Kentucky leads the country in the number of adults who smoke -a leading cause of lung and bronchus cancer.  Sadly, Kentucky also leads the country in lung and bronchus cancer deaths.  Within the state, however, there are big regional differences with the blue counties in southeastern Kentucky having the highest death rates from lung cancer.

Thursday, December 19, 2013

New Mexico Becomes 17th State to Legalize Same Sex Marriage

The New Mexico Supreme Court ruled today that the state must provide marriage licenses and equal benefits to both opposite sex and same sex couples.  Previously New Mexico's marriage law was gender neutral regarding the sexes of couples and thus was silent on whether same sex marriages were legal or not.
Various county clerks in New Mexico had begun issuing marriage licenses this year.  The court decision clears the way for marriage throughout the Land of Enchantment.

What Do Duck Dynasty's Phil Robertson, A Gay Teacher, Paula Deen, Martin Bashir, and An Expectant Boston Catholic Couple Have in Common?

Americans love their free speech.  Our big mouths are mouthing off about something all the time.  The Internet -an American invention after all- seems ready made to give the power of owning your own newspaper to anyone with a computer, blog, or Facebook.  I'm a case in point for sure.

This week brings another minor skirmish in America's culture wars with Phil Robertson, the patriarch of the Duck Dynasty reality TV show, inciting anger and a public backlash over expressing his personal views that black Americans were happier under segregation and that he lumps gay families in with the rape of animals (bestiality) and other sins.  While outside of the American mainstream, Robertson's views are probably not uncommon among his generation of working class whites in rural Louisiana.  Keep in mind that Paula Deen -who is 66 and from a white, working class background in rural Georgia- admitted using the "N word" in a court deposition.  She was quick to add that while this racist epithet was common in her youth in the South, it is no longer acceptable.  Under contract with the Food Network, the channel dropped Deen over the uproar from the racially charged lawsuit against her by a former employee.  Likewise, Robertson is under contract with the A&E channel.  Yesterday, his employer cut him from the show for his public remarks.

Robertson's remarks drew condemnation from the NAACP, GLAAD and others.  Others disagreed with his remarks but upheld his right to express his personal viewpoint -some out of free speech concerns and others out of support for his conservative interpretation of Christianity.  A&E's suspension in turn drew condemnation for Robertson supporters.

This post explores the issue of free speech and the workplace.

First of all, our US laws protect citizens' free speech from government interference.  Employers frequently put restrictions on employees' free speech as a condition of their employment.  These restrictions and situations arising from them come up across the political spectrum.  Cases in point:


  • A Pennsylvania Catholic school recently fired a popular teacher who has worked at the school for 12 years.  Why?  He and his long term male partner sought and received a license to marry in neighboring New Jersey.  The school felt his marriage would violate Catholic teachings -and thus also his contract.
  • In Massachusetts another Catholic school recently fired two heterosexual teachers.  Their wrongdoing?  They had begun dating and were expecting a child out of wedlock.  The school said their pregnancy violated their contracts.
  • Paula Deen lost her cooking show, book deals, and a sizable chunk of her cooking empire after an African American employee filed a racial discrimination case and Deen admitted to having used the "N word" in the past.
  • MSNBC suspended Martin Bashir for nasty remarks for public figure Sarah Palin.  He later resigned.
  • MSNBC and Alec Baldwin also parted ways this year after MSNBC cancelled his show and suspended him after video went public of him shouting anti-gay slurs at paparazzi.  
  • Now A&E have suspended Phil Robertson over at Duck Dynasty for violating his contract for expressing his opinions in a public GQ interview.  
The three teachers would likely either have their jobs or have good standing for wrongful termination if they worked at a public school.  They didn't:  they signed on to teach at Catholic schools that have particular morality clauses in their contracts.  Robertson's views would be mild in comparison to the viewpoints put forward on the Rush Limbaugh or other shows, but he agreed to work for A&E -on their terms.  

The point here is that when you sign a contract or agree to employment with a company, you are often agreeing to limit your free expression of your opinions and beliefs.  You might feel these seven people were wronged, but the law says they signed onto these jobs knowing the restrictions.  Be aware.


Wednesday, December 11, 2013

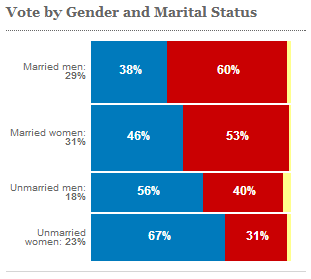
Unmarried v. Married: Election 2012

Graph courtesy of CNN.com
This next set of maps looks at exit polling data comparing unmarried and married people by gender.  It is interesting to see considerable differences between the unmarried -and presumably younger in many cases- voters and likely older voters.

Unmarried women -regardless of living in a Blue/Democratic or Red/Republican state- voted 2-to-1 for Mr. Obama.  Most unmarried men -even those living in most Red states- supported the Democratic ticket.

Married women reflect a pattern closer to the actual state win/loss map.  Their spouses, however, voted primarily Republican -even if living in a Blue state.


Tuesday, December 10, 2013

If Only Latinos Voted

As with yesterday's post, CNN's exit polling data are limited for Latino men and women.  Here are the maps for the existing data:


President Obama won more than 7 of every 10 votes by Latinos in 2012.  

Monday, December 9, 2013

If Only Black Women and Black Men Voted


CNN did not collect exit polling data for a number of states in 2012.  In those states where exit polling was conducted, data on the voting preferences of black and Hispanic Americans are also limited.  In some cases the public data shows results for black women but not black men.  Here are the resulting maps.

President Obama won 9 of every 10 votes -or higher- among black voters.


Sunday, December 8, 2013

If Only White Women Voted


While white men voted solidly for former Gov. Mitt Romney and the Republicans in 2012, the pattern for white women is more complicated.  Women voters supported President Obama by 55% (Obama) to 45% (Romney) overall.  On the other hand, only 45% of male voters supported the Democratic ticket.

If you compare the two maps, you can see that majorities of white women and men were mutual in their support for the Obama ticket in only four states:  WA, OR, VT, and MA.  In another 7 states (CA, NY, NH, ME, WI, IA, and MN), white voters split:  white women supported Obama; white men supported Romney.


Saturday, December 7, 2013

If Only White Men Voted, Part 2

Among the states where CNN gathered exit polling data, Romney won overwhelmingly among white men -a core voting bloc for the GOP. A majority of white male voters supported President Obama's re-election in only four states:  WA, OR, VT, and MA.

In fact, the last time a Democratic presidential candidate won a majority of white voters was in 1964 -and race has a LOT to do with this pattern.  In 1860 the Northern states where slavery was abolished voted solidly for Abraham Lincoln, the Republican candidate.  The Democratic Party had splintered between Northern and Southern interests into the National (Northern) Democratic Party and Constitutional (Southern) Democratic Party.  A fourth party, the Whig Party, had been a strong force in US politics for two decades but had dissolved.  Some former Whigs formed a new fourth party, the Constitutional Union Party, that also ran in the 1860 presidential election.

The Southern slave states voted overwhelmingly for the Southern faction of Democrats or the Constitutional Union Party.  Only Missouri voted for the Northern faction of the Democrats.  The united Republicans in the North successfully elected Lincoln to the White House in 1860.  By April of the next year the US was embroiled in its civil war.

After the Civil War, a basic pattern emerged where the North voted primarily Republican and the "Solid South" supported Democrats overwhelmingly.  In 1964, President Lyndon Johnson, a Southern Democrat from Texas, signed the Civil Rights Act into law.  This law ensured American adults regardless of race could vote.  When he signed the law, Johnson pondered that he might be handing the South over to the Republicans.  Sure enough, white voters revolted.  Since the Civil Rights Act was signed into law, former Dixiecrats have moved en masse to the Republican Party.  No Democratic presidential candidate has broken 50% of the the white vote since 1964 -though Carter, a Southerner, almost did with 48% of the white vote in 1976.

Today the party patterns have largely flipped with the Old South a Republican stronghold in terms of national politics.  Likewise, New England moderate Republicans are all but extinct with the former Union states largely voting Democratic in national elections.

You can compare white male voters' outcomes above to the outcomes for each state for the whole population of voters below:


Friday, December 6, 2013

If Only White Men Voted


Check out the full story at Buzzfeed
The folks over at Buzzfeed did a series of interesting maps outlining the 2012 election results if -as was the law before 1870- only white men could vote.  My hat off to Buzzfeed for showing history in a new and intriguing way.

This led me to exploring CNN's 2012 exit polling data in this next series of maps.

Thursday, December 5, 2013

Election 2012 and Future Demographics

Since the 2012 election, there have been a number of analyses of votes and exit polling data.  The news for the Republican Party has been grim and led to a report by the Republican National Committee outlining the demographic and ideological issues hampering Republicans in national and US Senate elections.

A quick recap:  While the GOP candidate (George W. Bush) ultimately took the majority of electoral votes in 2 elections, the Democratic candidate has won more votes nationally than the Republican presidential candidate in 5 of the 6 last elections.  More Democrats have been elected to the US Senate.  And in 2012 Democratic candidates won more votes overall in US House elections than Republican candidates.

So why isn't the US House controlled now by Democrats?  Good question.  The answer goes back to the 2010 US Census and reapportionment.  The express purpose of having a census every 10 years is to reapportion the US House of Representatives and state legislatures.  Each state -regardless of population- gets 2 US Senators.  US House seats, however, depend on a state's population.  Kentucky for example used to have 8 House seats but its sluggish growth compared to other states led to a reapportionment over the past few decades.  Now Kentucky has 6 House seats.

In 2010 with the recession that began under President Bush in full swing and the Tea Party activists at their zenith, the Republican Party won control of more state legislatures than the Democrats.  When the 2010 Census data came out, both parties set to reapportioning their states -usually to the advantage of their particular party.  Today's US House of Representatives reflects this reapportionment -or gerrymandering in some people's views.  In 2012 all 435 House seats were up for election.  Here are the results:

2012 Election: US House of Representatives
% of Popular Vote
% of House Seats Actually Won
Democratic Party
48.8
46.2
Republican Party
47.6
53.8
Libertarian Party
1.1
0
independents
0.6
0
Green Party
0.3
0
Constitution Party
0.1
0
Reform Party
0.1
0
Independence Party
0.1
0
Source:  US House of Representatives, Office of the Clerk, Election Statistics

If the US House was structured more as a parliamentary system where seats are divided up proportionally to the popular vote, Democrats would control the US House and several smaller parties would have a seat or two.  Instead, because each House seat is determined by the voters only in that seat's district -and these districts were carefully crafted to the advantage of the party in control of the state legislature in 2010-2012, the minority party in the popular vote controls the US House.

This next series of maps explores some of the demographic factors influencing the declining fortunes of the GOP in national popular votes.

Monday, December 2, 2013

Fornication Laws II


Earlier I posted a map of now defunct laws banning premarital sex or cohabitation from 1996.  Today I'm offering you a look at when the 16 states who had these laws in 1996 enacted them.  We have a big range here:  from colonial times in Massachusetts (1692) to Arizona as late as 1977.

Saturday, November 30, 2013

Fornication

When I asked various friends and family members to list the Ten Commandments -the alleged cornerstone of the American legal system and the biggest no-nos in Judeo-Christian theology-, I found most people could not name all ten.  Instead, many confused other behaviors viewed as sins as part of the Ten Commandments. Fornication -or premarital sex- was a common erroneous entry in the Big 10.

This next set of maps focuses on issues of sex.

Today I start with laws criminalizing premarital sex...or good ol' fornication.  These fornication statutes are distinct from adultery laws I've discussed earlier.  In 1996 sixteen states retained laws criminalizing sex outside of marriage.  In three -Arizona, New Mexico and North Dakota- premarital sex itself was not illegal but a couple living together outside of marriage was prohibited.

A number of these laws are still on the books, but they have rarely been enforced in the late 20th century. The 2003 Lawrence v. Texas decision by the US Supreme Court struck down the last remaining consensual sodomy laws specifically.  The decision also firmly removed the government from the bedrooms of American citizens, and it is thought to have made fornication laws unenforceable.


Friday, November 29, 2013

Americans and Alcohol

Do you drink?  Are you in the majority or minority?

Well, according to a poll Gallup does annually, the majority of Americans adults -60% in fact- say they drink some type of alcoholic beverage.  Most drinkers say they have consumed at least one alcoholic beverage in the past week with beverage choices evenly split between beer and wine.

The US Centers for Disease Control and Prevention (CDC) conducts a survey of typical high school students nationally every two years.  This Youth Risk Behavior Survey (YRBS) finds that in 2011 71% of high school students reported they had consumed at least one alcoholic drink and one in five reports binge drinking (5 or more alcoholic beverages in a row).

The CDC conducts a similar survey of health behaviors among adults called the Behavioral Risk Factor Surveillance Survey (BRFSS).  The 2012 BRFSS finds that 55% of American adults have consumed an alcoholic drink in the past 30 days.   Seventeen percent (17%) of adults report binge drinking, and 6% report being heavy drinkers (2 alcoholic beverages a day for men and 1 alcoholic beverage a day for women).

Thursday, November 28, 2013

Wet, Moist, and Dry Counties

Map courtesy of Wikipedia.
Thanks to the good volunteers over at Wikipedia, today's map of US counties shows the current status of liquor laws at the county level.  The majority of American counties (blue) are Wet counties allowing alcohol to be sold.  The red counties on the other hand are Dry counties where local laws ban alcohol sales.  The bulk of these dry counties are in Kentucky, Virginia, and Arkansas.  Finally, the yellow counties are the less well known category of Moist counties.  Moist counties represent an area with both wet and dry areas.  These usually are dry counties with a wet town or other wet business such as a golf course.

Wednesday, November 27, 2013

Who Sells the Booze?

As a teenager I grew up in North Carolina where all liquor had to be bought at a state-owned ABC (Alcohol Beverage Control) store.  For years I thought this was true in every state and just assumed the liquor stores on TV were also ABC stores.  Most states, however, allow privately owned but state licensed stores to sell beer, wine, and distilled spirits (liquor).  In 16 of the 18 states operating ABC stores, private stores and licensed grocery stores can sell wine and beer but not liquor.  Alabama and Utah restrict all alcoholic beverage sales -including beer, wine, and liquor- to state owned and operated stores.  Maryland has a mix of both ABC stores in some counties and private liquor stores in others.

Alcohol laws in the US are holdovers from the repeal of Prohibition in 1933.  The alcohol laws in various states vary considerably.  For instance, in North Carolina you must buy liquor at an ABC store, but you can buy beer and wine at the grocery store.  In Kentucky, liquor laws dating to the 1930s allow grocery stores to sell beer but require a separate license AND separate entrance/store to sell liquor and wine.  Recently there has been a push to allow grocery stores to sell wine in the actual grocery store -a move against which some liquor stores are lobbying.  In Utah you cannot technically order a double shot of alcohol, but you can order two single shots in two separate glasses.  And while New Hampshire requires all liquor sales go through state-owned ABC stores, the state kindly advertises its ABC stores with those giant, green, metal signs on NH interstates.


Tuesday, November 26, 2013

What's Up with Knoxville and Turkeys?

Google Trends offers hours of bizarre fun.  With Thanksgiving fast approaching, I decided to see what trends pop up for the word "turkey".  And what interesting trends emerge:


First, you can see the cyclic nature of searches for "turkey".  As Thanksgiving rolls around each year, more people search for "turkey."


But it turns out more people from Tennessee search for "turkey" than any other state.  Hmmm...


And it turns out that all those turkey searches are coming more from Knoxville than other parts of the state.


Gobble, gobble indeed.

Monday, November 25, 2013

Thou Shalt Not Make Unto Thee Any Graven Image

Idolatry in the ancient Torah was squarely aimed at reminding early Jews to not stray into worshipping other deities.  As with the commandment about not putting another deity before Yahweh, theologians view this commandment as originally focusing on forbidding the worship of images of other gods and goddesses.

Theologians since the time of St. Augustine, however, have grappled with what this commandment means to modern Jews and Christians.  Many theologians argue that idolatry today means putting anything ahead of respect for God.

So just how does one quantify this for a blog post?

I decided I'd turn to Google.  Most of the world's major religious and spiritual philosophies started in just four regions now in the countries of India (Hinduism and Buddhism), Israel (Judaism and Christianity), China (Daoism and Confucianism), and Saudi Arabia (Islam).  So, in these four countries -plus the United States- how often do people use Google to search for the term "God"?

It turns out there is quite some variation.  Americans search for this term considerably more than people in the other four countries.  India comes a close second with occasional spikes in searches for this term.  At one point around 10% of Indian Google searches were for "God".

I also looked into what terms are the most searched for terms in these countries on Google.  In all of these countries except China, the most common search term is "Facebook".  In China the most common Google search term is "Shanghai".

Sunday, November 24, 2013

Thou Shalt Not Covet

Coveting is rather difficult to quantify, but cars are big ticket items that are likely coveted by covetous neighbors.  So, for this sin in my rundown of the Ten Commandments, I thought I would look at motor vehicle thefts in 2012.  According to the FBI data, California, Nevada, and Washington are hotspots for auto theft.  The District of Columbia again has the highest auto theft rate, but I have excluded it.  As with thefts in general, the northern tier of the country reports fewer auto thefts.

Saturday, November 23, 2013

Thou Shalt Not Steal


So, where are you most likely to be robbed? It turns out to be South Carolina for the year 2012.  The Palmetto State had the highest theft rate per 100,000 population of any state in 2012 according to the FBI's Uniform Crime Reporting data.  Actually, the tiny urban enclave of the District of Columbia had a higher theft rate in 2012, but DC isn't a state.  DC also more closely resembles large US cities so I have excluded it to create this map.

Theft is in fact more common across the southern tier of the US all the way to Arizona and Utah.  Interestingly, the theft rate is lowest in Idaho and New Jersey.

I should add one caveat:  thefts reported to the FBI involve the victim first reporting the crime to the local authorities and then the authorities reporting to the FBI.  So, I should say the reported theft rate.

Friday, November 22, 2013

Thou Shalt Not Bear False Witness Against Thy Neighbor

I looked for statistics on perjury convictions by state but was unable to find any.  So, I'm a bit stumped about how to quantify bearing false witness.  So, instead, I'm offering you a map looking at the overall violent crime rate for 2012.  Violent crimes include reported murders, rapes, and aggravated assaults.  Again, I've excluded DC -which again has the highest violent crime rate- because its crime rates are more indicative of a city than a state.

The southern tier of states overall have higher violent crime rates -as does Alaska.  Let's look a bit deeper into specific types of violent crimes.


Murder rates are highest in Louisiana and Mississippi and lowest in Vermont and New Hampshire.


The pattern is different for rapes with the Plains states and Alaska having higher rape rates compared to the lower rates along the East Coast and California.


Finally, let's look at aggravated assault.  This crime focuses on intentional bodily attacks on another person. In all states, aggravated assault with a deadly weapon brings greater penalties than simple assault.  The central South stands out here with Tennessee having a much higher crime rate for assault in 2012.

Of note are the similar patterns for violent crime overall, murder, and aggravated assault.  Rape rates, however, stand out as a different pattern to crime.

Honour Thy Father and Mother

I found statistics on elder abuse by state difficult to find.  I eventually turned to the CDC's WISQARS database on violent deaths.  The above map shows the crude violent intentional death rate per 100,000 population of seniors in 2010.  In other words, this maps shows the crude rate for suicides and homicides of seniors by state for 2010.  I did not only map the homicides because there were too few numbers for most states to compute a rate.

The above map looks at the mean rate of violent senior deaths and then looks at states' whose rate is unusually high or low -by several standard deviations.  As you can see, Nevada has an unusually high senior violent death rate.  Massachusetts has a relatively low rate.  While I did not map the violent homicide rate for seniors, I did look at it.  For the states with enough killings to compute a rate, Nevada again had the worst (highest) rate of murders of its seniors.  In general, seniors are more likely to die from violence in the West and least likely to die of intentional violence in the North/Midwest.  The South is about in the middle.

Thursday, November 21, 2013

Remember the Sabbath Day

Nevermind that the Jewish Sabbath starts at sundown on Friday and ends at sundown on Saturday, most Christians view Sunday as the Sabbath.  Various state blue laws restrict commerce on Sunday -especially in the area of liquor sales.  Today's map shows the 12 states (red) that retain such laws.  In a number of these 12 states, beer and wine sales are allowed after church gets out (i.e. after 12pm or 1pm).

Curiously, Texas also requires car dealerships to close either Saturday or Sunday each weekend.

Wednesday, November 20, 2013

Migration Between States: Interactive Graphic

Interstate Migration
My friend Mark shared this fantastic interactive graph with me.  It shows Chris Walker's visualization of migration between the states.  By moving your cursor over a state, you can see the flows between that state and others.  If you move your cursor over the flow line, you can see the actual figures for the direction and number of people moving each way.

Check Chris' Graphic Out:  
Interstate Migration

Sunday, November 17, 2013

Thou Shalt Not Take the Name of God in Vain: Blasphemy Laws

As part of my Ten Commandments series, it has been rather difficult finding laws dealing with blasphemy. Unlike a number of countries such as Sweden, Saudi Arabia, etc., the United States specifically is a secular nation with a Constitution banning the government from establishing a specific religion.  Thus, it is challenging at best to have a secular law banning blasphemy.  Yet, six states in 2009 had statutes mentioning blasphemy. I was able to find a New York Times article mentioning blasphemy statutes tied to a Pennsylvania court case that eventually overturned that state's blasphemy law.  Moral of the story:  if your government doesn't have an official deity, it's hard to blaspheme against Him/Her/It/Them.

Saturday, November 16, 2013

Thou Shalt Have No Other Gods Before Me: Religious License Plates


The first commandment in Exodus focuses on having no other gods before Yahweh/Jehovah/God.  Some theologians argue this commandment does not dictate monotheism but commands the supremacy of Jehovah above other deities.  Some archaeological evidence even points to early Israelites worshipping a consort or wife to Yahweh named Ashera.

Nevertheless, the US is a secular country without a state religion.  So, our Federal, state, and local governments are hands-off theological questions, but I did find an issue to map:  religious license plates!

As of 2013, 21 states offer some type of religious license plates either with the "In God We Trust" motto or "God Bless America."  Six states (AL, GA, SC, FL, KY, and IN) offer these plates withe the word "God" on them at no extra cost over regular license plates.  In the other states, the Godly plates cost extra and usually benefit some charitable group.

Georgia is something of a special case.  It issues standard license plates without the "In God We Trust" motto but allows motorists to put a free sticker issued by the Georgia DMV on their plates with the motto.

Do such plates violate the Constitutional separation of church and state?  A lawsuit in Indiana led to an Indiana Court of Appeals decision upholding the state's "In God We Trust" no-cost alternative license plate.  Perhaps because of the slippery legal grounds for such plates, no state currently uses the word "God" on its standard plate.

Friday, November 15, 2013

Death Penalty Abolition

Since the US Supreme Court's 1976 rulings allowed the resumption of executions, 8 states have abolished their death penalties either through legislative or state court rulings.  


Thursday, November 14, 2013

Where You Would Be Most Likely to Face the Death Penalty?

If convicted of a capital crime, where would you be most likely to face the death penalty?  The answer is an easy one:  Texas!  The Lone Star State accounts for more than a third of all people executed in the United States since 1976.  Of the 1,352 people executed since 1976, 506 of these executions have been in Texas.

In fact, half of all executions occur in just three states:  Texas, Virginia, and Oklahoma.  Of the big three executor states, though, Oklahoma -with a population of under 4 million- has the most executions per capita.  Oklahoma has 36,000 people per 1 execution compared to the much larger states of Texas and Virginia with 51,500 people per one execution and 74,400 people per one execution respectively.


A handy cartogram shows how the states with the most executions out of total executions.

Wednesday, November 13, 2013

And Lo, the First Shall Be...16th


Hawai'i became the 16th state (plus DC) to legalize the recognition of marriage between same-sex couples. It is somewhat ironic that 15 other states and DC beat Hawaii to the finish line on gay marriage.  In the 1990s many thought Hawai'i would be the frontrunner on expanding marriage to same-sex couples.  In a court case running from 1991 to 1999, a HI judge -using directions from the HI Supreme Court- ruled in 1996 that denying marriage to same-sex couples was unconstitutional.  The HI Supreme Court, however, waited to decide the case until a ballot measure passed a 1998 constitutional amendment specifically giving the legislature the power to regulate same-sex marriage.  The Hawai'i legislature promptly then banned same-sex marriage until it changed its mind this month in a special session. As a result, the HI Supreme Court in 1999 upheld the new constitutional amendment banning marriage.

While Vermont became the first state to legalize civil unions granting most of the benefits of civil marriage to same-sex couples in 2000, Hawai'i did not successfully pass a civil union law until 2011 -after the state's then Governor, Linda Lingle (R), vetoed an earlier civil union bill in 2010.

Adding to the oddness of Hawai'i's approach is the unprecedented deluge of 1000s of individual citizens allowed to speak their opinions about same-sex marriage before the HI House.  Many of these opinions were talking points by opponents that reiterated what other citizens had already said.  On top of this, the first openly gay legislator to vote AGAINST civil rights for LGBT people, Rep. Jo Jordan (D), voted against same-sex marriage. Oddly, she voted for civil unions in 2011 and says she supports same-sex marriage -just not the bill that passed.

So, the excitement of Hawai'i's legal decisions in 1996 took 17 years to finally result in upholding the court opinion that denying marriage to same-sex couples was unconstitutional.  While better late than never as the saying goes, Hawai'i's nearly two decades of foot-dragging makes this week's vote somewhat bittersweet.

Tuesday, November 12, 2013

Execution Methods

While the majority of states have a death penalty, methods of execution vary.  The Danish company which made the drugs used by most lethal injection method states recently was barred by Danish law from exporting these drugs to countries with a death penalty -including the United States.  This has left states scrambling to find new, deadly execution drugs.

Most states with a death penalty include lethal injection as an execution option.  Most also allow some other type of method ranging from electrocution to the gas chamber to firing squad.


Monday, November 11, 2013

The Death Penalty


Source:  2012, Gallup
The majority of Americans support the death penalty, but in most states it is rarely used.  Let's look a bit deeper into the issue of death penalties as part of my 10 Commandments posts on killings and the "culture of life."

As of 2011, 18 states have abolished their death penalties.  


Sunday, November 10, 2013

Polls: Moral v. Legal

Yesterday I blogged a bit about Gallup's annual morals poll:


As I mentioned yesterday, what Americans believe is moral does not always align with what they feel should be legal.  Abortion polling reflects this differentiation in the American electorate.  

Source:  2013, Gallup

Fully 78% of Americans support legalized abortion in some or all circumstances.  The minority opposing abortion in all circumstances has remained fairly static at between 12% and 23% since Gallup began tracking this question in 1975.
Graph courtesy of 2013, Gallup

So, that must mean only 1 in 5 Americans view themselves as pro-life, right?  Think again.  While 78% of Americans support some form of legalized abortion, 48% of Americans view themselves as pro-life.  What Americans feel is moral -for themselves or perhaps even for others- does not always align with how they would vote in terms of the legality of an issue.