
Showing posts with label CDC. Show all posts
Showing posts with label CDC. Show all posts
Monday, July 7, 2014
Is the Typical American Fat?
Wednesday, May 28, 2014
The Typical American's Health

Monday, May 26, 2014
More of the Typical American's Health

Friday, May 23, 2014
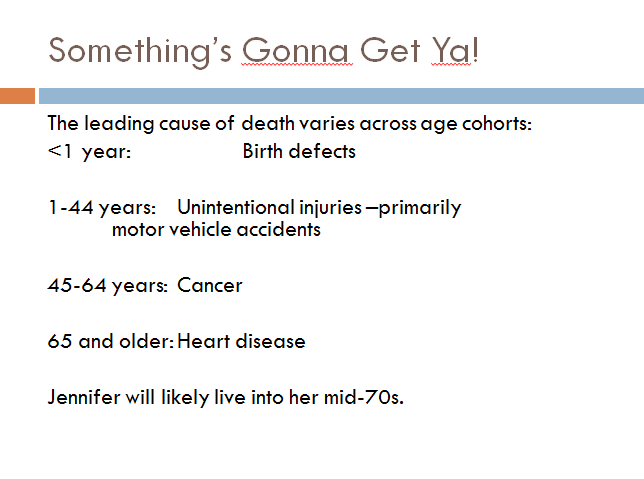
Americans Die of Different Things at Different Ages
Wednesday, May 21, 2014
The Typical American's Death

Friday, January 3, 2014
Gestational Diabetes

Thursday, January 2, 2014
Diabetes in America

Another kind of diabetes develops among some pregnant women -gestational diabetes. Diabetes is an inflammatory disease and some recent studies point the possibility that Alzheimer's disease is actually Type 3 diabetes.
In more than a fifth of states -12 to be exact- the percentage of diabetic adults has now risen to more than 10%.
Wednesday, January 1, 2014
Fat in America

Measuring obesity is somewhat complicated. Because it is a relatively easy measure to gather, most survey data -including the CDC's Behavioral Risk Factor Surveillance Survey (BRFSS) data- use people's height and weight to calculate their Body Mass Index (BMI). It is far from a perfect measure. If you really are "big boned" as the country saying goes or are muscular, you may have a higher BMI but not be overweight. Or, you might come from an ethnicity of smaller framed people and rate as underweight when you are actually a healthy weight. Still, for most people, the BMI is a relatively accurate measure of obesity.
The CDC breaks overweight people into the categories of Overweight (see above) and Obese (see below). Overweight people have a BMI of 25 to 29.9. Obese people have a BMI of 30 or higher. Being overweight puts you at risk for a shorter life, heart disease, diabetes, knee problems, and even psychological issues related to stigma against the overweight.
You'll notice that some states have relatively high percentages of people who are overweight but not that high of percentages of people who are obese. Arizona stands out with this pattern. Mississippi -which leads the country in the highest percentage of overweight and obese adults- has a relatively low percentage of people who are overweight in part because so many adults have transitioned into the obese category.
Even while obesity has risen across the country, a general pattern has emerged where the western states and northern tier states are relatively thinner than the South.

Tuesday, December 31, 2013
Toothless in Tennessee

As part of my continuing series on health data from the 2010 Behavioral Risk Factor Surveillance Survey (BRFSS), I thought I'd look at seniors who are missing all their teeth. While this may seem a humorous topic, having poor oral health can open the door for bacteria and shave around 7 years off your life.
This map breaks the data by standard deviations from the mean/average. So the pale, gray/white states' seniors are average -for the USA- in the percentage who are toothless. The purple states have higher percentages of toothless seniors with WV, TN, MS, and KY having the worst data on senior oral health.
My friend Lee B. from Clinton, CT, used to tell me that people in Connecticut had great teeth. Apparently she is right because the Nutmeg State and Hawaii have the most older Americans with their choppers.
Monday, December 30, 2013
Non-Smokers

Sunday, December 29, 2013
Where Have Smoking Cessation Programs Had the Biggest Impact?
In this continuing series on health data, let's look today at smoking.
The CDC lists smoking as the #1 preventable cause of early death. Around 40% of people who smoke will eventually develop some type of health problem related to smoking. Thus, smoking cessation and prevention programs for decades have -successfully I might add- greatly reduced the number of Americans to smoke.
In looking at data from the CDC's Behavioral Risk Factor Surveillance Survey (BRFSS) of adult health behaviors, I was curious if there were any regional differences showing where smoking cessation programs have had the biggest impact. And it appears the answer is YES! -specifically in New England and Arizona which so the biggest percentages of people who have quit smoking.
Let's look at the maps individually:


Interestingly, most American adults who smoke also smoke daily. Less than 10% of American adults report they smoke but only a few days a week.
This last map shows the key differences. People in Utah are the least likely to ever smoke. Thus, Utah also has the lowest percentage of former smokers -because fewer people ever started smoking. In most of the rest of the country, the percentage of former smokers is somewhere between 20-30% of the adult population. The key exceptions are VT, NH, ME, and AZ where a larger percentage of the population has stopped smoking. All four of these states actually had higher percentages of adults who have smoked or currently smoke but have had more success in adults quitting.

Friday, November 22, 2013
Honour Thy Father and Mother

The above map looks at the mean rate of violent senior deaths and then looks at states' whose rate is unusually high or low -by several standard deviations. As you can see, Nevada has an unusually high senior violent death rate. Massachusetts has a relatively low rate. While I did not map the violent homicide rate for seniors, I did look at it. For the states with enough killings to compute a rate, Nevada again had the worst (highest) rate of murders of its seniors. In general, seniors are more likely to die from violence in the West and least likely to die of intentional violence in the North/Midwest. The South is about in the middle.
Subscribe to:
Posts (Atom)