
Showing posts with label politics. Show all posts
Showing posts with label politics. Show all posts
Friday, May 16, 2014
The Typical American's Voting Practices

Friday, February 21, 2014
The Typical American, Born in the USA?

According to data from the 2012 American Community Survey, 1 in 7 American residents were born outside the United States. About half of the foreign-born residents are now US citizens. With the focus of "birther" conspiracists who argue that President Obama was born outside the US, there has been more attention given to the Constitution's requirement that only a natural born citizen can be President. There are some interesting political factoids around this issue and recent US presidential elections:
- In 2012, the fathers of both the Democratic (Obama) and Republican (Romney) candidates were born outside the United States. President Obama's father was born in Kenya. Gov. Romney's father was born in Mexico.
- In the 2008 presidential election, the Republican candidate, John McCain, was born outside the US. He was born in Panama in what was then the US Panama Canal Zone to American parents. His grandfather and father at the time were commanders of the Coco Solo submarine base and a submarine based there.
- At one time there was discussion about amending the US Constitution to allow any citizen to run for President. This discussion arose around the possibility of Austrian-born former California governor Arnold Schwarzenegger running for President.
So exactly how does one become a natural born citizen? The Constitution does not define this term but according to Wikipedia, a 2011 Congressional Research Service report laid out the argument that this term applied to anyone who met the requirements for citizenship at birth. Thus, that would include anyone born in the United States regardless of whether one, two, or none of the baby's parents are US citizens. US Senator Ted Cruz for example was until recently both an American and Canadian citizen because he was born in Canada to an American mother and a Cuban father. He has since renounced his Canadian citizenship. While his father was not a US citizen until 2005, I do not know if his Cuban-born father was a Cuban or Canadian by citizenship at the time of his birth. Cruz could possibly file to have Cuba recognize him as a citizen too!
The second way one becomes a natural born citizen is by being born to an American citizen who is abroad. George Romney (former governor of Michigan and Mitt Romney's father), John McCain, and Ted Cruz all fit this category. Oddly, even if Barack Obama was born in Kenya -as some birthers claim- to his Kansas-born American mother, he would still be a natural born citizen. These birthers obsess about where he was born but none appear to refute that his mother was an American citizen.
The US is a nation born of immigrants stretching back 10,000s of years to when the first humans arrived. That process is not complete: today millions of Americans are newcomers to this country.
Friday, January 17, 2014
The Typical American, Political Party

Gallup just released a new poll on January 8, 2014, of 18,000 Americans that finds the largest percentage of Americans ever identifying as independents. While the percentage of Americans identifying as Democrats has held steady since 2010, a number of former Republicans have shifted to identifying as independents. Thus, Jennifer, our Typical American, would identify as an independent. Party registration and party identification tend to be in monthly flux from Gallup data. Thus, Jennifer might be registered as a Democrat or Republican but identify her party based on her current satisfaction or dissatisfaction with a political party.
Gallup also finds in another poll that 78% of American adult citizens are registered to vote. So, Jennifer is registered to vote.
George
Mason University’s Elections Project estimates the 2012 voter turnout to have
been 58.2% of the voting eligible population. The
majority of Americans –and thus Jennifer- vote during presidential elections
but do not vote in non-presidential elections.
Wednesday, December 11, 2013
Unmarried v. Married: Election 2012
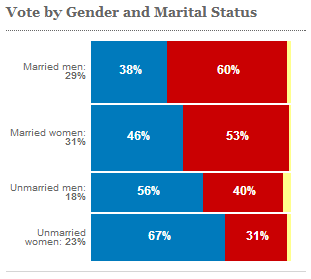 |
| Graph courtesy of CNN.com |
Unmarried women -regardless of living in a Blue/Democratic or Red/Republican state- voted 2-to-1 for Mr. Obama. Most unmarried men -even those living in most Red states- supported the Democratic ticket.
Married women reflect a pattern closer to the actual state win/loss map. Their spouses, however, voted primarily Republican -even if living in a Blue state.


Tuesday, December 10, 2013
If Only Latinos Voted
As with yesterday's post, CNN's exit polling data are limited for Latino men and women. Here are the maps for the existing data:


President Obama won more than 7 of every 10 votes by Latinos in 2012.
Sunday, December 8, 2013
If Only White Women Voted

While white men voted solidly for former Gov. Mitt Romney and the Republicans in 2012, the pattern for white women is more complicated. Women voters supported President Obama by 55% (Obama) to 45% (Romney) overall. On the other hand, only 45% of male voters supported the Democratic ticket.
If you compare the two maps, you can see that majorities of white women and men were mutual in their support for the Obama ticket in only four states: WA, OR, VT, and MA. In another 7 states (CA, NY, NH, ME, WI, IA, and MN), white voters split: white women supported Obama; white men supported Romney.

Saturday, December 7, 2013
If Only White Men Voted, Part 2

In fact, the last time a Democratic presidential candidate won a majority of white voters was in 1964 -and race has a LOT to do with this pattern. In 1860 the Northern states where slavery was abolished voted solidly for Abraham Lincoln, the Republican candidate. The Democratic Party had splintered between Northern and Southern interests into the National (Northern) Democratic Party and Constitutional (Southern) Democratic Party. A fourth party, the Whig Party, had been a strong force in US politics for two decades but had dissolved. Some former Whigs formed a new fourth party, the Constitutional Union Party, that also ran in the 1860 presidential election.
The Southern slave states voted overwhelmingly for the Southern faction of Democrats or the Constitutional Union Party. Only Missouri voted for the Northern faction of the Democrats. The united Republicans in the North successfully elected Lincoln to the White House in 1860. By April of the next year the US was embroiled in its civil war.
After the Civil War, a basic pattern emerged where the North voted primarily Republican and the "Solid South" supported Democrats overwhelmingly. In 1964, President Lyndon Johnson, a Southern Democrat from Texas, signed the Civil Rights Act into law. This law ensured American adults regardless of race could vote. When he signed the law, Johnson pondered that he might be handing the South over to the Republicans. Sure enough, white voters revolted. Since the Civil Rights Act was signed into law, former Dixiecrats have moved en masse to the Republican Party. No Democratic presidential candidate has broken 50% of the the white vote since 1964 -though Carter, a Southerner, almost did with 48% of the white vote in 1976.
Today the party patterns have largely flipped with the Old South a Republican stronghold in terms of national politics. Likewise, New England moderate Republicans are all but extinct with the former Union states largely voting Democratic in national elections.
You can compare white male voters' outcomes above to the outcomes for each state for the whole population of voters below:

Thursday, December 5, 2013
Election 2012 and Future Demographics
Since the 2012 election, there have been a number of analyses of votes and exit polling data. The news for the Republican Party has been grim and led to a report by the Republican National Committee outlining the demographic and ideological issues hampering Republicans in national and US Senate elections.
A quick recap: While the GOP candidate (George W. Bush) ultimately took the majority of electoral votes in 2 elections, the Democratic candidate has won more votes nationally than the Republican presidential candidate in 5 of the 6 last elections. More Democrats have been elected to the US Senate. And in 2012 Democratic candidates won more votes overall in US House elections than Republican candidates.
So why isn't the US House controlled now by Democrats? Good question. The answer goes back to the 2010 US Census and reapportionment. The express purpose of having a census every 10 years is to reapportion the US House of Representatives and state legislatures. Each state -regardless of population- gets 2 US Senators. US House seats, however, depend on a state's population. Kentucky for example used to have 8 House seats but its sluggish growth compared to other states led to a reapportionment over the past few decades. Now Kentucky has 6 House seats.
In 2010 with the recession that began under President Bush in full swing and the Tea Party activists at their zenith, the Republican Party won control of more state legislatures than the Democrats. When the 2010 Census data came out, both parties set to reapportioning their states -usually to the advantage of their particular party. Today's US House of Representatives reflects this reapportionment -or gerrymandering in some people's views. In 2012 all 435 House seats were up for election. Here are the results:
A quick recap: While the GOP candidate (George W. Bush) ultimately took the majority of electoral votes in 2 elections, the Democratic candidate has won more votes nationally than the Republican presidential candidate in 5 of the 6 last elections. More Democrats have been elected to the US Senate. And in 2012 Democratic candidates won more votes overall in US House elections than Republican candidates.
So why isn't the US House controlled now by Democrats? Good question. The answer goes back to the 2010 US Census and reapportionment. The express purpose of having a census every 10 years is to reapportion the US House of Representatives and state legislatures. Each state -regardless of population- gets 2 US Senators. US House seats, however, depend on a state's population. Kentucky for example used to have 8 House seats but its sluggish growth compared to other states led to a reapportionment over the past few decades. Now Kentucky has 6 House seats.
In 2010 with the recession that began under President Bush in full swing and the Tea Party activists at their zenith, the Republican Party won control of more state legislatures than the Democrats. When the 2010 Census data came out, both parties set to reapportioning their states -usually to the advantage of their particular party. Today's US House of Representatives reflects this reapportionment -or gerrymandering in some people's views. In 2012 all 435 House seats were up for election. Here are the results:
2012 Election: US House
of Representatives
|
% of Popular Vote
|
% of House Seats Actually
Won
|
Democratic Party
|
48.8
|
46.2
|
Republican Party
|
47.6
|
53.8
|
Libertarian Party
|
1.1
|
0
|
independents
|
0.6
|
0
|
Green Party
|
0.3
|
0
|
Constitution Party
|
0.1
|
0
|
Reform Party
|
0.1
|
0
|
Independence Party
|
0.1
|
0
|
Source: US House of
Representatives, Office of the Clerk, Election Statistics
|
||
If the US House was structured more as a parliamentary system where seats are divided up proportionally to the popular vote, Democrats would control the US House and several smaller parties would have a seat or two. Instead, because each House seat is determined by the voters only in that seat's district -and these districts were carefully crafted to the advantage of the party in control of the state legislature in 2010-2012, the minority party in the popular vote controls the US House.
This next series of maps explores some of the demographic factors influencing the declining fortunes of the GOP in national popular votes.
Subscribe to:
Posts (Atom)